Projects
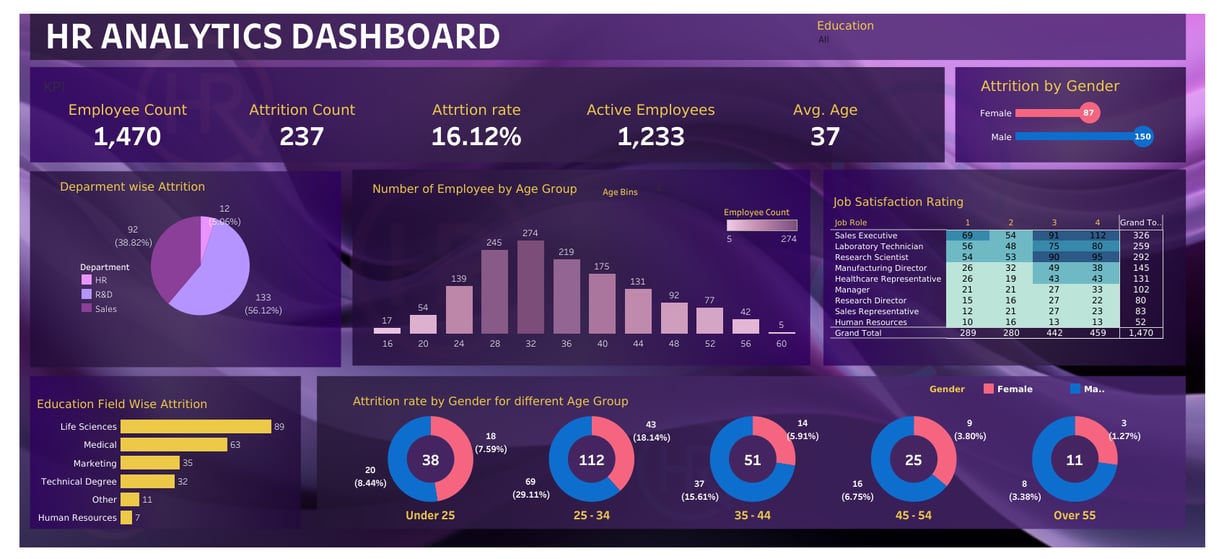
HR Analytics Dashboard
Dashboard Overview:
In our project, we focused on several key performance indicators (KPIs) to gain insights into workforce dynamics and inform strategic decision-making. These included Attrition Rate by Gender, Age Group, and Department, enabling us to identify trends and patterns across various demographics and organizational units. Additionally, we examined Male vs. Female Attrition to understand gender-specific turnover dynamics and develop targeted retention strategies.
Furthermore, we incorporated the Count of Employees for each adjustable field, providing a comprehensive overview of workforce composition and distribution. Additionally, we utilized a heat map to visualize job satisfaction levels across different job roles, allowing us to pinpoint areas of concern and opportunities for improvement. Lastly, we included a chart for Education Field Attrition, shedding light on attrition trends based on educational backgrounds.
By leveraging these KPIs and visualizations within our Tableau Dashboard, we were able to effectively monitor attrition rates, identify factors influencing job satisfaction, and make informed decisions to optimize workforce management and enhance organizational performance.
Data Analysis: NFL Homefield Advantage 2013 -2023
( Leveraged Against the Vegas Spread)
Welcome to our NFL Against the Spread Homefield Advantage project!
In this analysis, we delve into the performance of NFL teams over the past five years, focusing specifically on their performance against the spread (ATS) at home versus away games. By meticulously analyzing margins against the spread, win rates against the spread, and comparative measures to the mean, we uncover valuable insights into the impact of homefield advantage on team performance.
Our study aims to identify outliers and teams with significant homefield advantage, shedding light on patterns and trends that may influence betting strategies and game outcomes. Through rigorous statistical analysis and data visualization techniques, we provide actionable insights for NFL enthusiasts, sports bettors, and analysts alike. Join us on this journey as we uncover the secrets behind the NFL's homefield advantage phenomenon.
Data Analysis: NFL Homefield Advantage 2013 - 2023
(Home Scoring Margins vs Away Scoring Margins)
Welcome to our NFL Homefield Advantage Study: Traditional Metrics
In this comprehensive analysis, we explore the dynamics of homefield advantage in the NFL using both traditional metrics rather then against the spread (ATS) data. This study focuses on teams' performance based on scoring margins, points allowed, and win percentages at home versus away games, while the previous study examines their performance relative to the betting line and their out performance compared to the public opinions predicted outcomes.
By utilizing these two approaches, we gain a deeper understanding of the nuances of homefield advantage and its impact on team performance. Through rigorous statistical analysis and insightful data visualization, we aim to uncover valuable insights that can inform betting strategies, team strategies, and fan engagement. Join us on this journey as we unravel the mysteries of homefield advantage in the NFL from multiple perspectives.
Stay in Touch
If you'd like to work with me or having any questions please feel free to reach out.